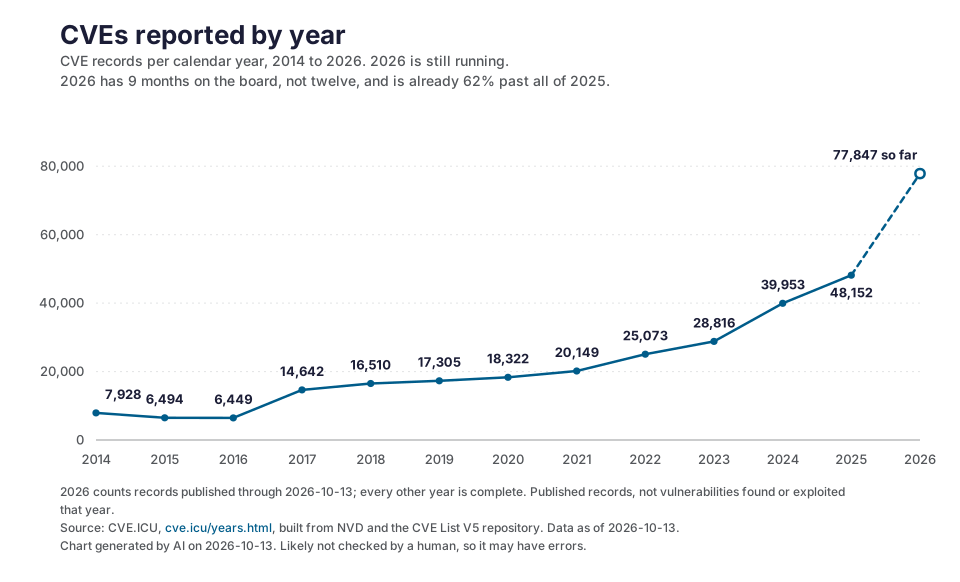
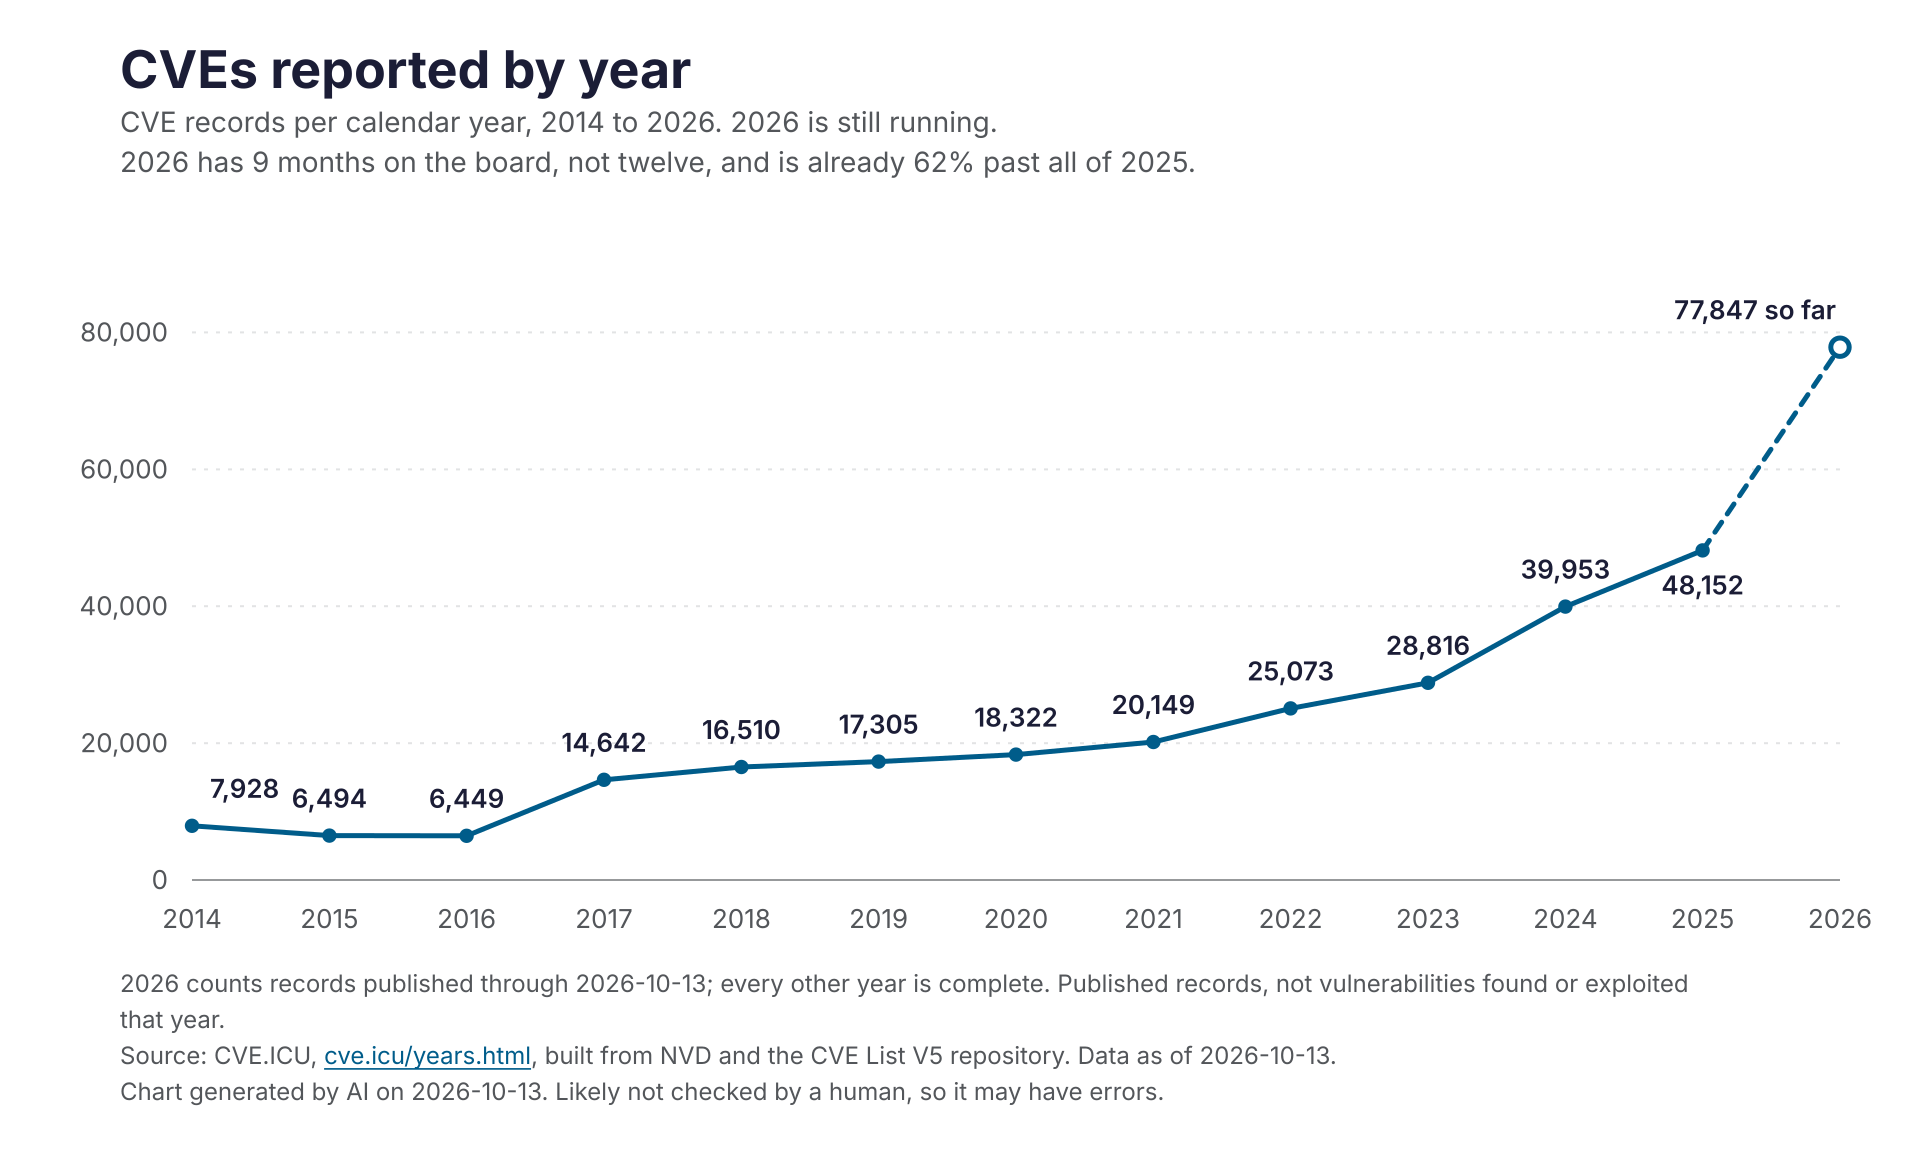
CVE records per calendar year, 2014 to 2026. 2026 is still running: it has 9 months on the board, not twelve, and is already 62% past all of 2025.
2026 counts records published through 2026-10-13; every other year is complete. Published records, not vulnerabilities found or exploited that year.
Source: CVE.ICU, built from NVD and the CVE List V5 repository. Data as of 2026-10-13.
Chart generated by AI on 2026-10-13. Likely not checked by a human, so it may have errors.
Download the chart with its labels as SVG or PNG, or the numbers as JSON or CSV.